11%
In 2018, building materials (especially steel, brick, and steel) were responsible for 11% of global greenhouse gas emissions.[1].
  • Demand for new buildings is expected to rise rapidly, driven by increasing populations, and wealth in Africa and Asia and by demand for upgrades of urban housing stock.
  • Building materials accounted for more than 50% of concrete production and 40% of steel production.
  • The demand for increased building materials can be mitigated somewhat by using materials with less environmental impact, such as increased use of wood. Cross-laminated timber (CLT) shows promise, providing the strength of concrete for one-fifth the weight. [2]. The use of wood locks in the carbon content for the life of the building. Despite advances in building technology, widespread use of less efficient building practices are still widely used, imposing a challenge in meeting global climate targets for GHG emissions.

References:

[1] 'Global greenhouse gas emissions from residential and commercial building materials and mitigation strategies to 2060' (Accessed on 15th November, 2023) https://www.nature.com/articles/s41467-021-26212-z
[2] '5 Benefits of Building with Cross-Laminated Timber' (Accessed on 15th November, 2023) https://cnr.ncsu.edu/news/2022/08/5-benefits-cross-laminated . . .
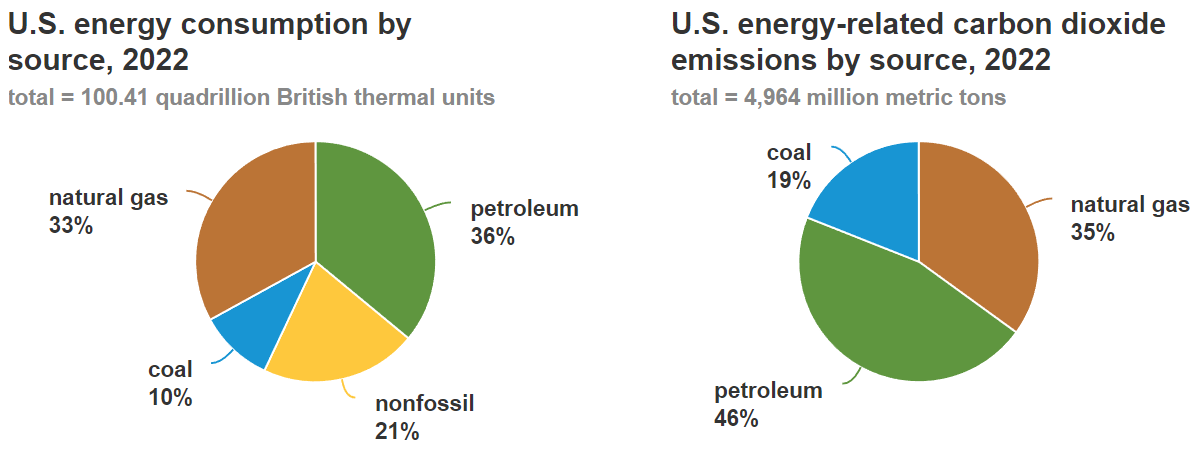
11% and 21%
In 2022, coal accounted for about 11% of U.S energy consumption but 21% of energy-related CO2 emissions, making coal the dirtiest energy of the coal, petroleum and natural gas fossil fuels triad [1].
fossil fuel consumption and associated CO2 emissions

Reference:

[1] 'Energy and the environment explained.' (Accessed on 19th November, 2023) https://www.eia.gov/energyexplained/energy-and-the-environme . . .
32% and 34%
In 2022, natural gas accounted for about 32% of U.S energy consumption but 34% of energy-related CO2 emissions [1].
fossil fuel consumption and associated CO2 emissions

Reference:

[1] 'Energy and the environment explained.' (Accessed on 19th November, 2023) https://www.eia.gov/energyexplained/energy-and-the-environme . . .
36% and 46%
In 2022, petroleum accounted for about 36% of U.S energy consumption but 46% of energy-related CO2 emissions [1].
fossil fuel consumption and associated CO2 emissions

Reference:

[1] 'Energy and the environment explained.' (Accessed on 19th November, 2023) https://www.eia.gov/energyexplained/energy-and-the-environme . . .
57%
Clouds created by
contrails Contrails are water condensation trails that are often visible as linear clouds behind airplanes. They are caused by water vapour in the air condensing around soot and other particles emitted from the jet engines in cold air (below about -40oC/-40oF). Under the right conditions, contrails can be hundreds of kilometres in length and exist for several hours.
account for roughly 57% of aviation's global warming impact [1].
  • Contrails that form cirrus clouds are not long-lived, in contrast to the CO2 emissions from aviation. Night-time contrails add to global warming by trapping warmth that would otherwise escape. Daytime contrails can actually reduce warming by reflecting some of the sun's radiation that would otherwise reach the earth's surface.
  • Aviation was grounded in the US for three days following the terrorist attacks on the World Trade Center on the 9th November, 2001, and the Pentagon. The diurnal temperature range (DTR) increased by
    1oC 1.8oF
    over the days before and the days after the grounding. It has been argued that the absence of contrails was responsible for the warmer days and cooler nights but it has also been argued that the change in DTR was not significant, and not out of line with other measured variability [2] [3].
  • When short-lived climate forcers (SLCF) are considered (contrails, nitrous oxide, soot, water vapour and black carbon), they amount to two-thirds of aviation's climate impact [4]. That is, these SLCFs warm the planet twice as much as does the associated CO2, vapour and black carbon), they amount to two-thirds of aviation's climate impact. That is, these SLCFs warm the planet twice as much as does the associated CO2. Aviation warms the planet three times more than the emitted CO2 would indicate.

References:

[1] 'Transport' (Accessed on 17th November, 2023) https://www.ipcc.ch/report/ar6/wg3/downloads/report/IPCC_AR6 . . .
[2] '9/11 research challenged: contrails aren't turning up the heat' (Accessed on 16th November, 2023) https://www.bbc.co.uk/blogs/climatechange/2009/05/911_contra . . .
[3] 'Contrails reduce daily temperature range' (Accessed on 16th November, 2023) https://www.nature.com/articles/418601a?error=cookies_not_su . . .
[4] 'Airline contrails warm the planet twice as much as CO2, EU study finds' (Accessed on 17th November, 2023) https://www.transportenvironment.org/discover/airline-contra . . .
2.00bn tonnes 1.97bn (long) tons
Greenhouse gas emissions dipped by a mere
2.00bn tonnes 1.97bn (long) tons
while most of us were confined to our homes in 2020 due to the Covid-19 pandemic [1].
  • International air travel dropped by 60% in 2020 due to the pandemic [2]. Yet worldwide greenhouse gas emissions dropped by less than 4% (2.00/54.6=3.66%). We can not make a serious dent in our emissions, let alone get to net zero, on the back of reduced air travel. Air travel (domestic and international, passenger and freight) contributes 1.9% of greenhouse gas emissions (2016 data), or 2.5% of CO2 emissions (2018 data) [3].
  • It is widely accepted that aviation has a considerable warming effect over and above that due to CO2 alone. Three times as much [4] - so airline travel may not be as benign as it appears.

References:

[1] 'Greenhouse gas emissions, 2021. Our World in Data.' (Accessed on 13th November, 2023) https://ourworldindata.org/greenhouse-gas-emissions
[2] '2020 passenger totals drop 60 per cent...' (Accessed on 14th November, 2023) https://www.icao.int/Newsroom/Pages/2020-passenger-totals-dr . . .
[3] 'Our World in Data.' (Accessed on 14th November, 2023) https://ourworldindata.org/co2-emissions-from-aviation
[4] this site... (Accessed on 14th November, 2023) https://numbers-matter.org/climate/problems/warming/causes#5 . . .
54.6bn tonnes 53.7bn (long) tons
Greenhouse gas emissions for 2021 are
54.6bn tonnes 53.7bn (long) tons
, up more than thirteen-fold from
4.0bn tonnes 3.94bn (long) tons
in 1850 [1].
  • Most of the news we hear about climate change involves carbon dioxide in the atmosphere but CO2 is only the largest of the emissions contributing to global warming. Other greenhouse gases that have added to global warming include methane and nitrous oxide.
  • Analysing emissions by country is not a useful metric. A country's emissions are influenced by both the emissions per capita and the population. We hear a lot about China's and India's high emissions: China's (
    13.7bn tonnes 13.5bn (long) tons
    in 2021) are much higher than those of the United States (
    5.93bn tonnes 5.84bn (long) tons
    in 2021). But greenhouse gases don't stop at international borders: we need to think in terms of what each of us emits worldwide. On a per capita basis, China is far from the worst emissions offender.
  • Some per capita figures for greenhouse gas emissions in 2021:
    Country
    Per capita emissions
    (billion tonnes)
    Mongolia
    27.9
    Canada
    20.4
    United States
    17.6
    China
    9.62
    United Kingdom
    6.26
    India
    2.77
  • Almost certainly, India's emissions will grow at a faster rate than ours in the prosperous 'West.' But we are responsible for causing most of the global warming problem, filling the atmosphere with greenhouse gases; who are we now to say, from our comfortable homes with our multiple vehicles, that the poor in India don't deserve electric lights and refrigerators?

Reference:

[1] 'Greenhouse gas emissions, 2021. Our World in Data.' (Accessed on 12th November, 2023) https://ourworldindata.org/greenhouse-gas-emissions